Hello Devs,
This blog will explain how to use DataDog to find disk utilisation. But before that tell me why it should be required.
While using EC2 machines we generally have attached EBS volume or extra EBS volume. You might have seen many times “No space left on device” or sometimes 100% utilisation state similar kinds of errors. On this error, you might have taken action by adding extra volume or resizing the current EBS volume. But sometimes that action we may take late because we get to know very late and this might cause customer user experience badly. Sometimes you oversize your volume and end up paying an extra cost. How to avoid this?
I will explain here how to avoid this and monitor EBS volume disk utilisation using Datadog. How it can save you from any incident and save your cost also.
Let's understand first why Disk utilisation is more important.
Why does Disk utilisation matter?
Your disk is nothing but your hard drive or in-cloud instance volume. This is not only used for saving data or your code but it plays an important role in writing and reading operations. This has the same weightage as the CPU or RAM. Every hard disk is capable of many read-and-write operations that decide what the IOPS rate is. So it will slow down your instance or PC. Customers or end users may face issues while accessing applications. Disk utilisation can reach a limit like 90% or 100% just because code or application demands more read and write operations which you can’t reduce.
So, Disk utilisation metrics are important for consumers to know how much storage is under or over-utilised to optimise the cost of disk. And also get over any incident. Observing Disk utilisation metrics can find out what pattern of usage in the general application is expected accordingly and can modify disk size.

But the question is how can I get early notification whenever disk utilisation reaches some threshold? how I can know what is disk average usage? Here Datadog can help.
DataDog ?
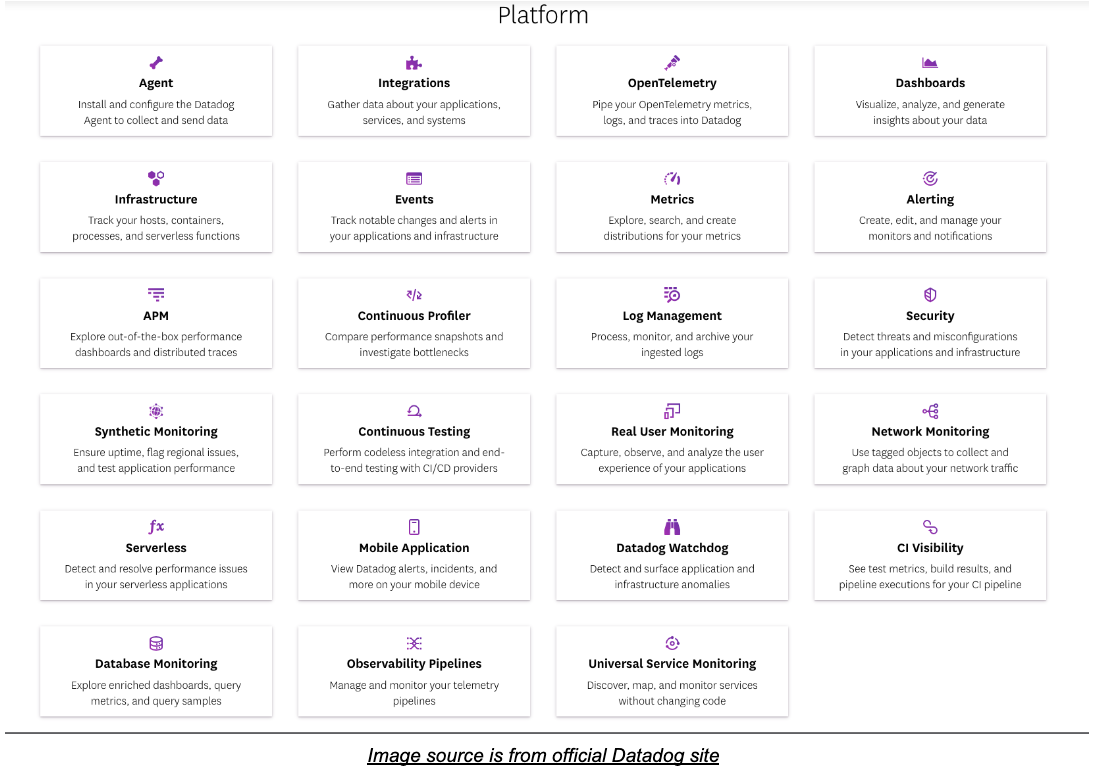
Datadog is one the best monitoring and log management platforms. Where you can integrate your on-premise or cloud instance or services to get all logs and metrics in one place. Datadog provides real-time monitoring and event triggering based on a metric threshold or logs message to act upon it.
How can Datadog help in Disk utilisation?
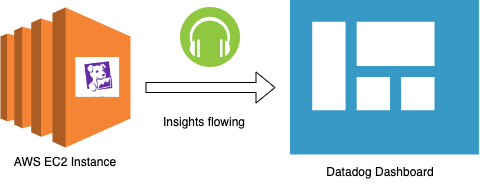
Datadog provides installation agents which need to be installed inside a server or instance. That agent will keep on dumping logging data and metric data to the Datadog dashboard. Datadog has a build mechanism based on a threshold of metrics like when “CPU usage more than 80%” or “disk usage cross 70%” can trigger notification to the respective team or member of the team via email or Slack or ops genie etc. Also based on the pattern of usage you can set the scaling of the disk.
Let me take an example of AWS EBS volume. AWS EBS volume provides CloudWatch metrics that can easily integrate with Datadog. Also as said above can install an agent and fetch logs within 15 seconds of the timeframe.
How to do this?
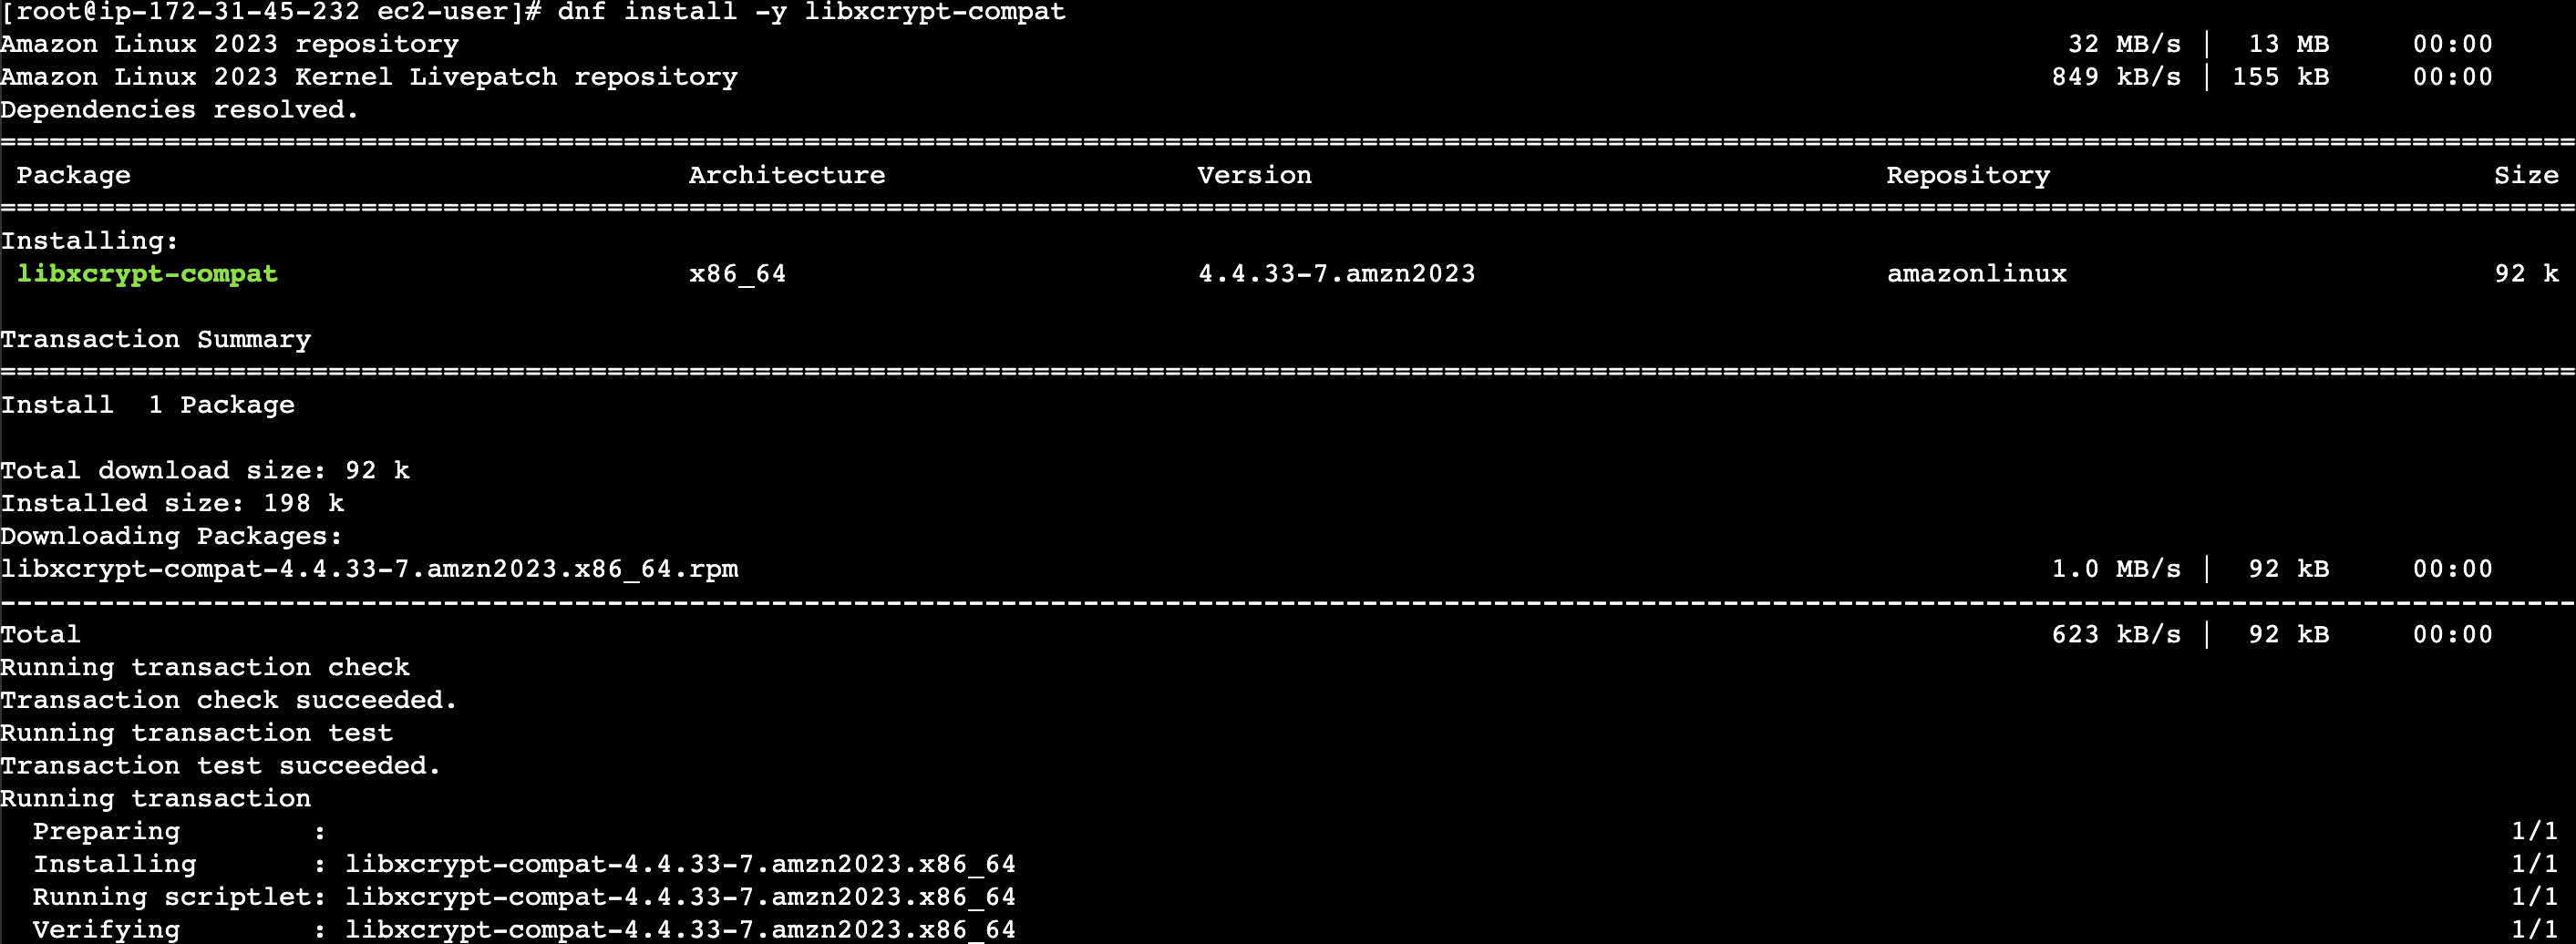
Let's understand how DataDog can be integrated with AWS EBS volume and fetch required metrics. Prerequisite for this you have already AWS EC2 running with the default volume attached.
First, if you haven't an account already with Datadog then create one on Datadog.com 14 days trial period is there.
After creating an account, you have to choose which platform you are going to integrate like AWS, Google, Docker, Azure etc.
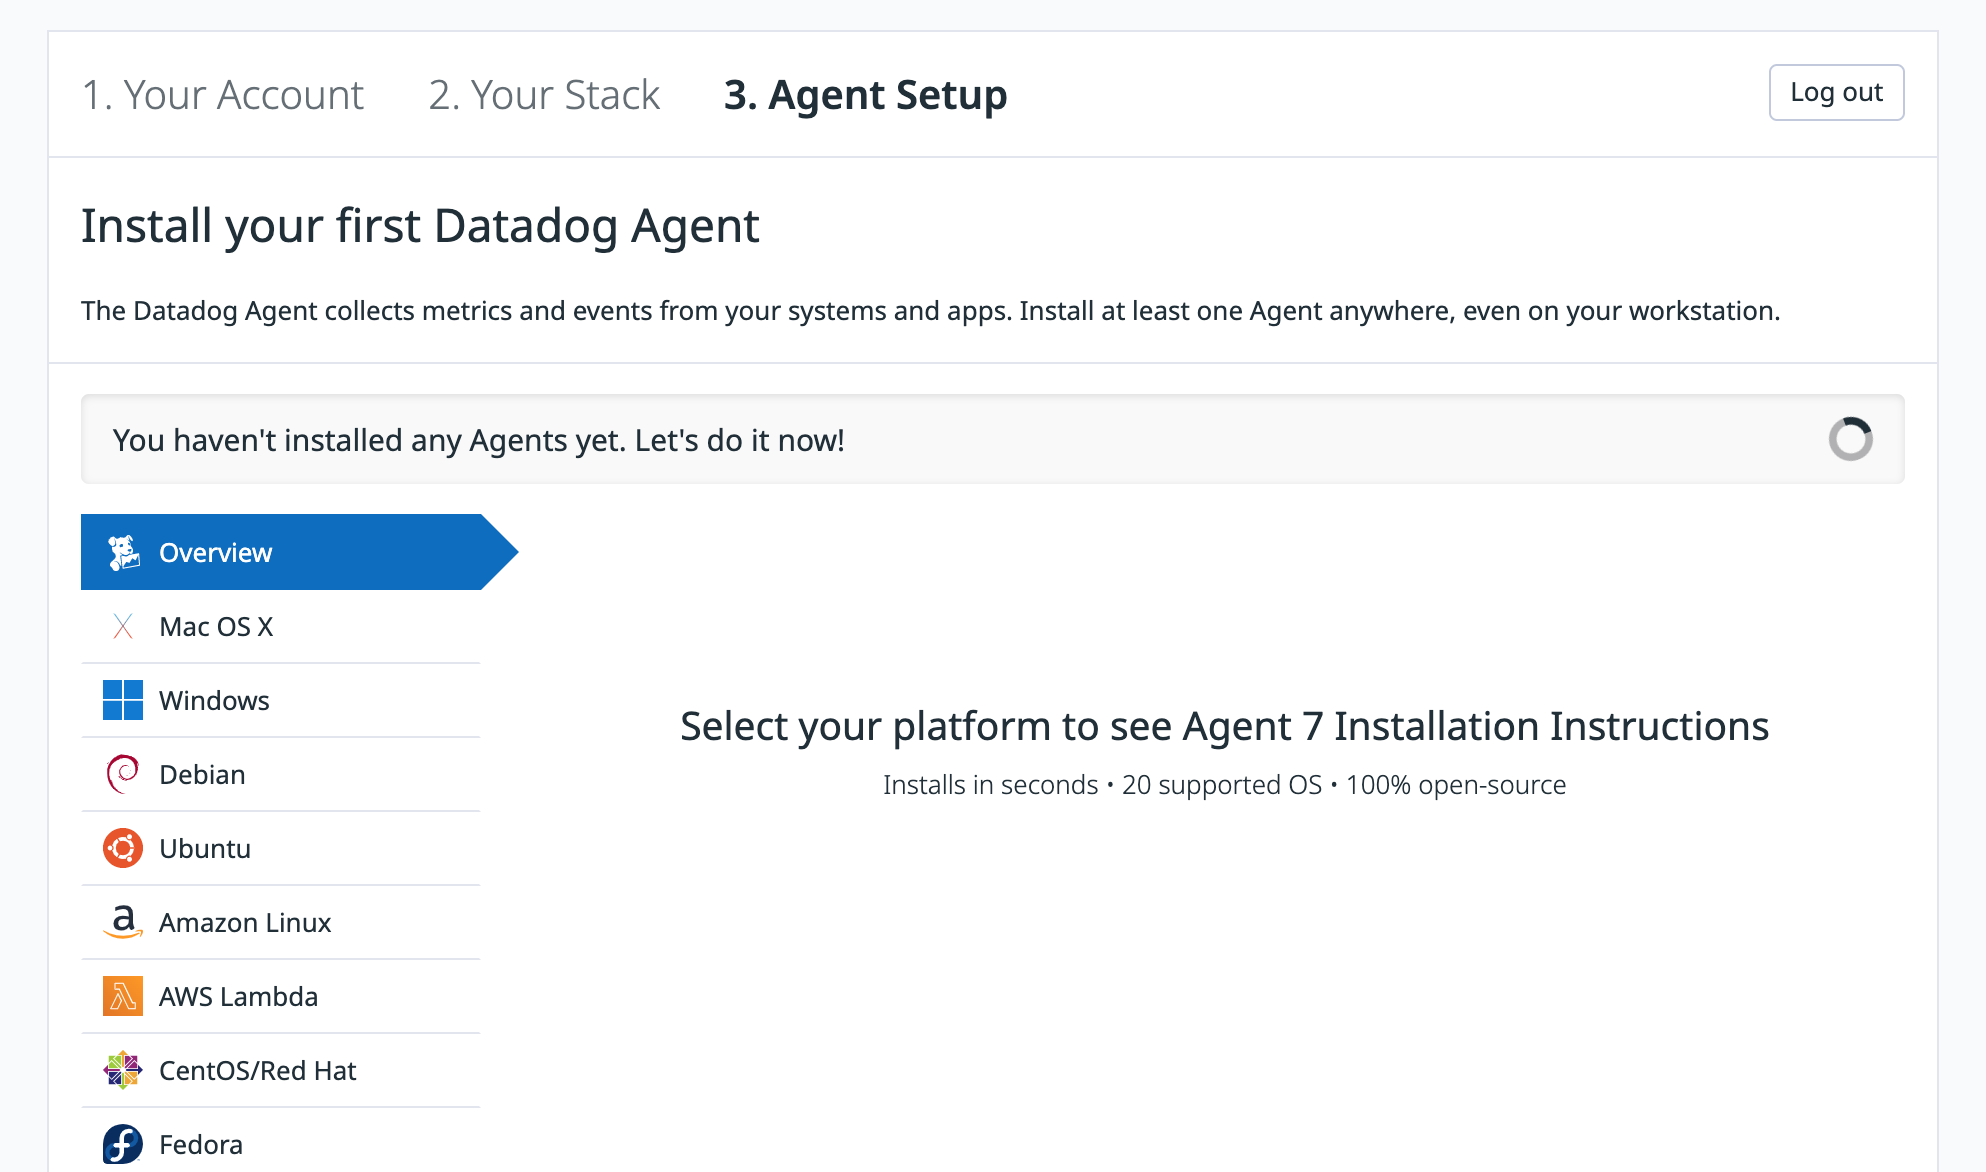
Choose an instance family-like OS.
Start following the steps mentioned on the page. Once all is complete click on Finish.

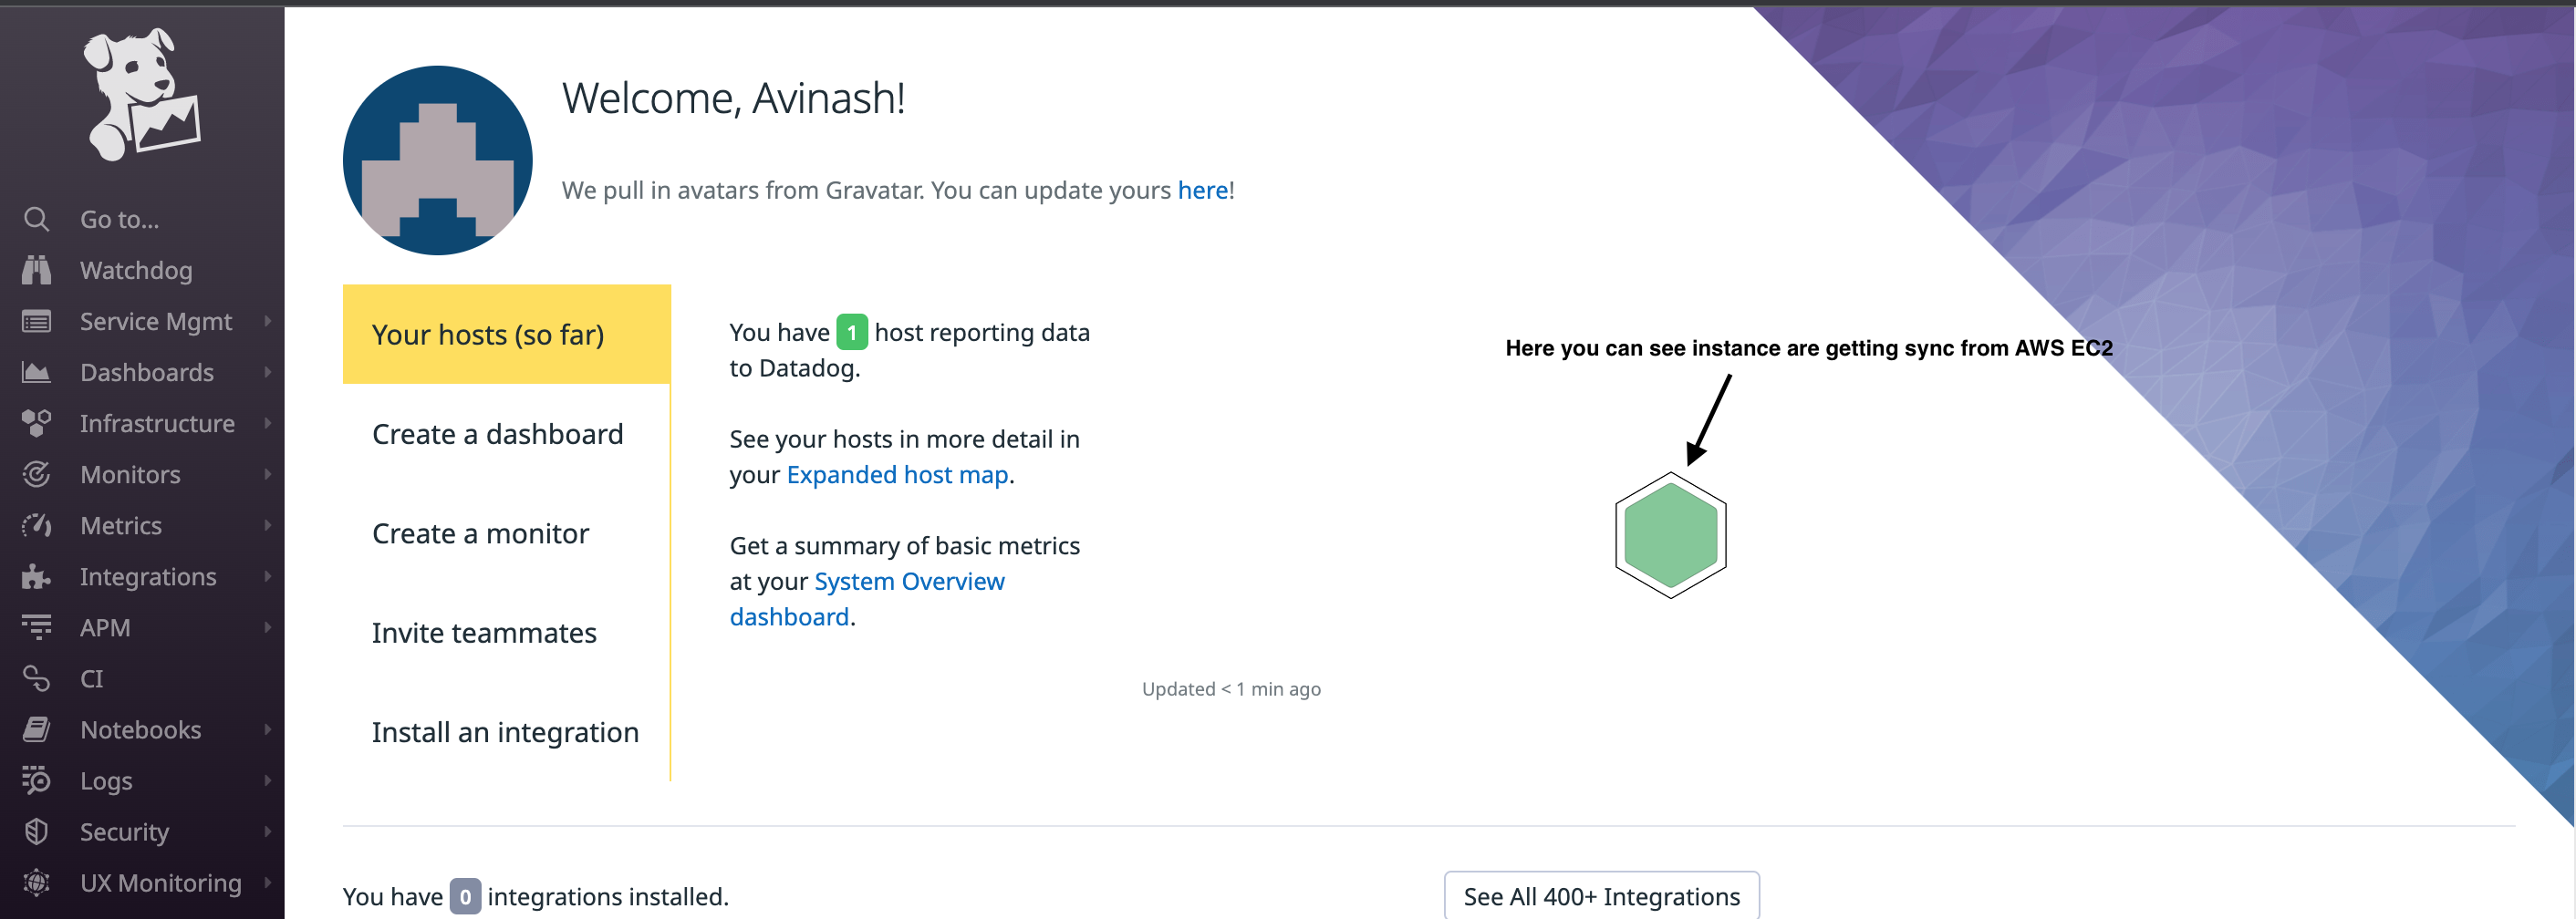
You will be redirected to https://app.datadoghq.com/ first welcome screen will look like this if you are doing it for the first time.
On the Left side, navigation click on Metrics -> Explorer -> Add query
Select disk-related query. For disk utilisation can select system.disk.in_use , system.disk.freeand system.disk.used

After running the query can see metrics showing on the page. Click on “Save to Dashboard”
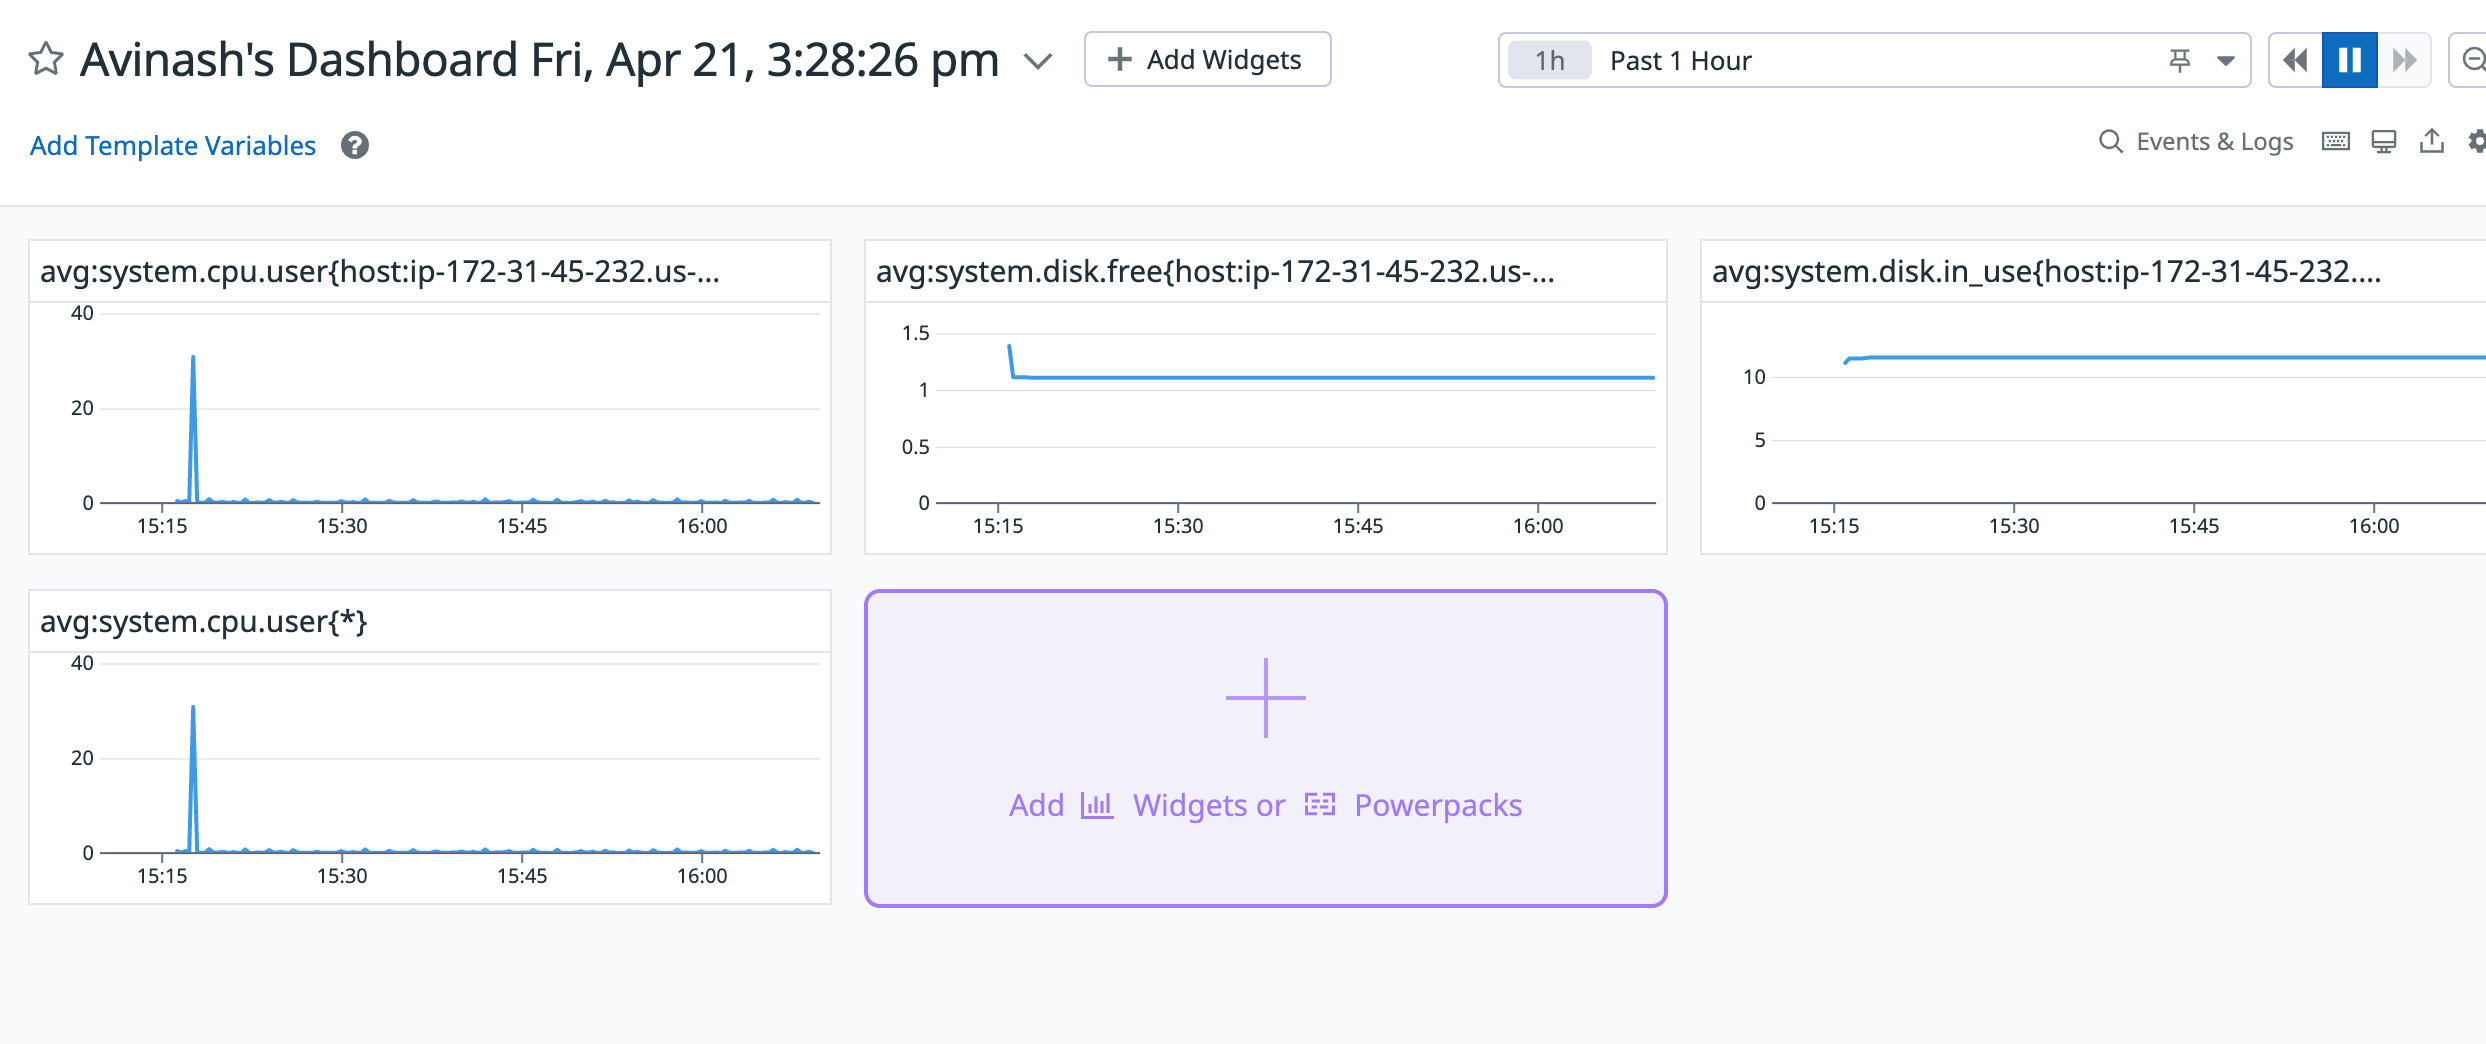
.
In the search query, you can play around more like adding formulas.
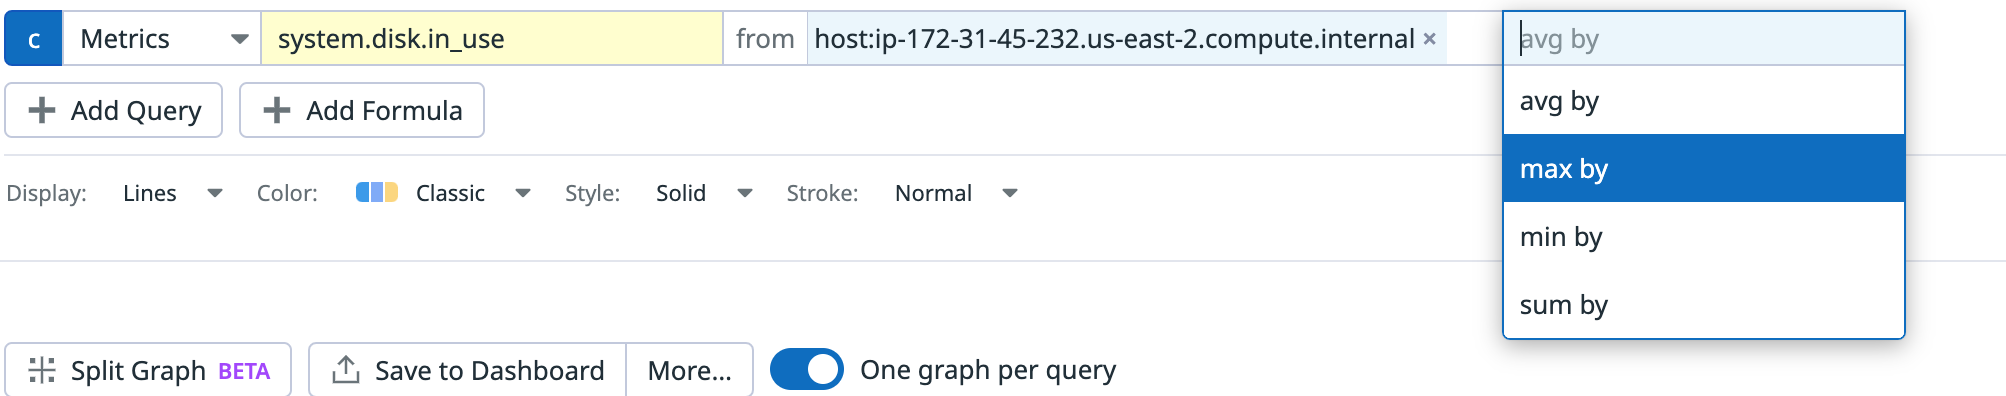
Like a few other metrics you can try out as per point #7.
Under “Monitor” you can create an alert whenever disk space is going above a threshold or under-utilised. ( optional step )
This is how the integration of Datadog with the instance is completed and able to view EBS volume metrics and follow patterns to decide on optimising cost :)
I hope this blog helps you to learn. Feel free to reach out to me on my Twitter handle @AvinashDalvi_ or comment on the blog.
References :